Now that I have the code in place to import XML data into arrays I can now start working on the how I will visually represent it.
Which results in:
Now that I have the code in place to import XML data into arrays I can now start working on the how I will visually represent it.
Which results in:
After several hours I’ve managed to cobble together some actionscript 3 to parse the XML information outputted by the program we are using.
xmlLoader.addEventListener(Event.COMPLETE, LoadXML);
xmlLoader.load(new URLRequest("data.xml"));

function LoadXML(e:Event):void {
xmlData = new XML(e.target.data);
Parse(xmlData);
}
This loads and reads the XML document and sends it to be Parsed.
This is the start of the code seeks out data by its tags and puts it into array. An if statement is used for each tag and i++; is used within the last if to cycle the array index.
var address = new Array(); ...

function Parse(Input:XML):void {
var Children:XMLList = Input.item.children();

for each (var Info:XML in Children) {

if (Info.name() == "address") {
address[i] = Info;
}
...
Inorder to load date information which comes in this form: 4/03/2010 11:53:33, into a form the times can be compared to find the greatest and lowest of all of them I used substring to extract them and then joined the data back together.
Fdetect[i] = temp.substring(11,13) + temp.substring(14,16) + temp.substring(17,19);

if (Fdetect[i] <>
style="font-size:78%;">Earliest = Fdetect[i];
}
If the current value is less then the stored lowest value then it replaces it. This allows me to automatically find the earliest and latest time for all of the data which is useful for visually representing it.
After weighing up the benefits of both ways of doing our project we have decided that the use of Arduino, though exciting, is over complex and that collecting the data using a laptop will allow us to focus on the visual element of our project.
After various inquiries using ardiuno for this project is possible however the original intention and motivation to have a number of small units left unattended is not achievable.
I will continue to post regarding Arduino as I would like to do a project using it at some point in the future.
This is an example of the standard XML output of the BluetoothView software. It looks to be easy to parse and ideal for our purposes.
Using this software we can quickly get some data to experiment with.

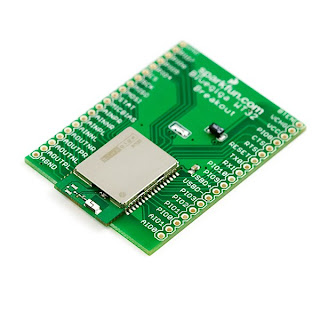
Bluetooth Breakout – Bluegiga WT-32- Bluegiga – iWrap

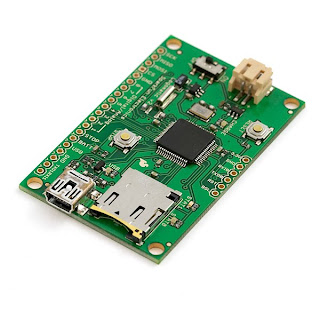
Logomatic v2 Serial SD Datalogger – Has a built in RTC(Real-Time Clock)
So far most of our thought has gone into how to collect the data rather than what we actually want to do with it. With our current skills it makes sense to use actionscript 3, processing which we are now learning or a combination.
One possible componant of the projection:
 However we feel this might be too direct.
One early idea which we discarded as we thought it would be too invasive was to set up a video camera to record footage of the people walking passed as we scan for bluetooth devices. We could of then attempted to either manually or through software roughly counted the number of people passing.
It looks like it should be possible to collect bluetooth data using an Arduino board with a bluetooth shield. This would make an idea device for recording the data as it would be small and easily portable. Looking around it seems that the most common/intended usage is for the bluetooth to be sending data rather then being used to simply scan, hopefully the hardware is flexible enough to allow this. It also appears that writing to a USB stick stick shouldn’t be too difficult.

The device is programmed using a simple standardised software in a language very similar to Processing. In the session we experimented with basic programming of the device by using some code to make an LED attached to it flash on and off. I replaced the set durations with random number generating so the time delays varied. I later rewrote it so the delay between flashes would start at 1000ms and over time decend so that the rate of flashing increased.